Hi everyone,
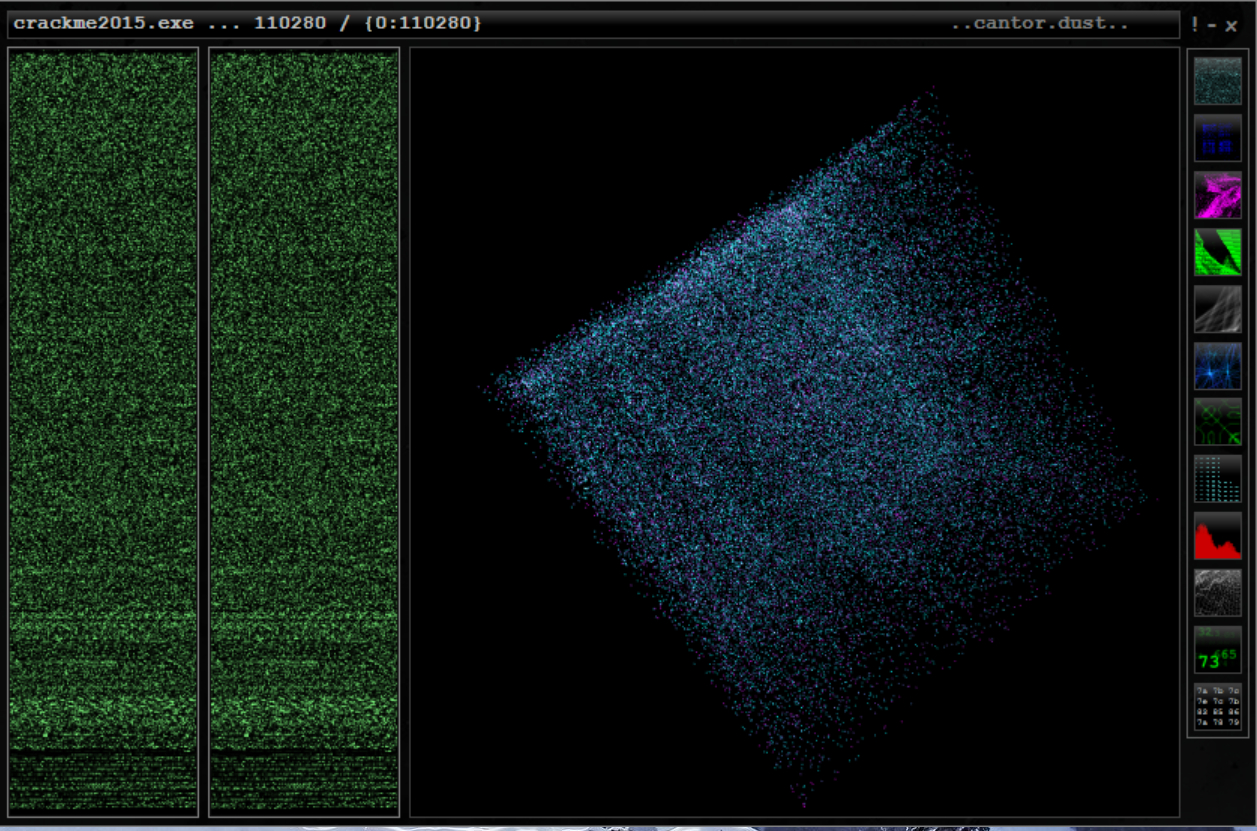
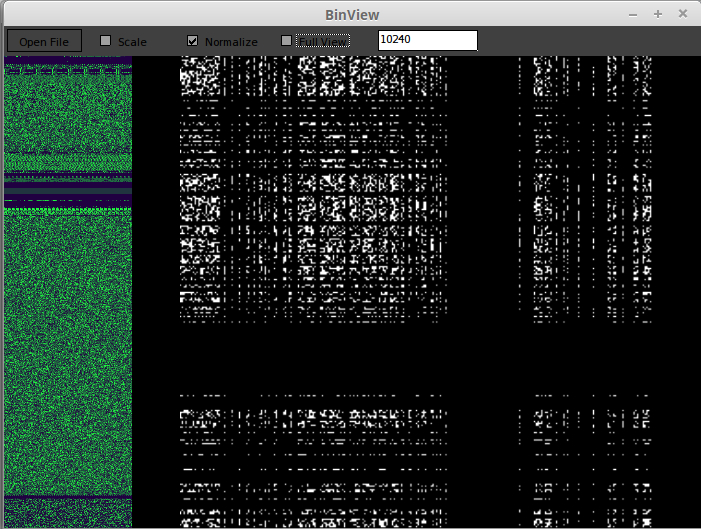
waiting for your reply of the previous post, the image in attachment... What does it mean? Same thing for the software called Cantor Dust... How can I interpret these graphics? The reason or explanation why the cube is in some points has cyan point... Is always entropy? Or there is another thing? And if is entropy you have some papers to advise me for studying this subject? Please reply me, I thanks all for your response...
Bye,
nosecure
Attachments